Ethernet Technology
Ethernet is the most widely used local area network (LAN) technology, defining how data is transmitted over wired connections. Developed by Xerox PARC in the 1970s and standardized as IEEE 802.3, Ethernet has evolved from 10 Mbps to modern 400 Gbps standards.
Historical Evolution
- 1973 Original Ethernet (2.94 Mbps) at Xerox PARC
- 1980 Ethernet II (DIX) standard - 10 Mbps
- 1983 IEEE 802.3 standard ratified
- 1995 Fast Ethernet (802.3u) - 100 Mbps
- 1998 Gigabit Ethernet (802.3z/ab)
- 2010+ 10/25/40/100/400 Gigabit Ethernet
Key Technical Concepts
CSMA/CD
Carrier Sense Multiple Access with Collision Detection - The original access method for half-duplex Ethernet where devices listen before transmitting and detect collisions.
Full-Duplex
Modern Ethernet uses switched full-duplex connections, eliminating collisions and allowing simultaneous transmission and reception.
MAC Addressing
48-bit hardware addresses burned into NICs, formatted as six hexadecimal octets (e.g., 00:1A:2B:3C:4D:5E).
Ethernet Frame Structure (IEEE 802.3)
Click on any field above to see detailed information
Ethernet Topologies
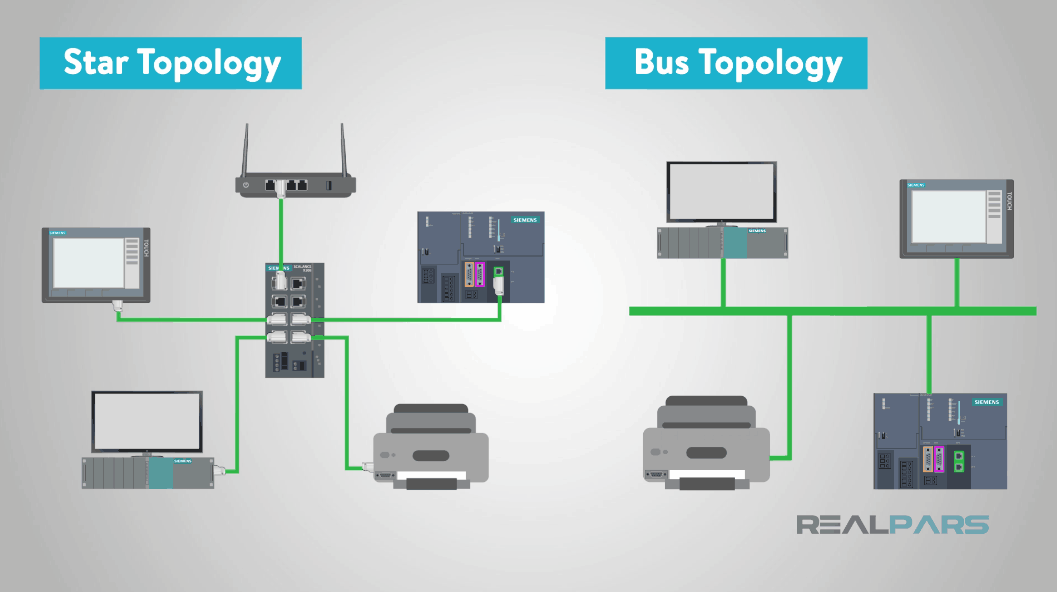
Star and Bus Topology Comparison
Star Topology (Modern)
All devices connect to a central switch. Most common today due to reliability, scalability, and full-duplex capability.
Bus Topology (Legacy)
All devices share a single coaxial cable. Used 10BASE5 and 10BASE2 standards. Deprecated due to collision issues.
Point-to-Point
Direct connection between two devices. Common for fiber links and switch-to-switch connections.
Interactive Ethernet Simulator
Frame Configuration
Frame Statistics
Frame Visualization
Laboratory Procedure
Ethernet Frame Analysis
Understanding the structure and fields of an Ethernet frame
Open the Frame Builder simulator in the Virtual Lab
Enter the destination MAC address: FF:FF:FF:FF:FF:FF (broadcast)
Enter your assigned source MAC address
Select EtherType 0x0800 (IPv4) and enter a sample payload of 100 bytes
Click "Build Frame" and observe the hex dump output
Identify and record each field: Preamble, SFD, Destination MAC, Source MAC, Length/Type, Data, and FCS
CSMA/CD Protocol Demonstration
Observing carrier sense and collision detection mechanisms
Navigate to the CSMA/CD Demo tab
Click "Station A Transmit" and observe the signal propagation along the bus
Record the sequence: Carrier Sense → Wait for idle → Transmit → Propagation
Click "Simulate Collision" to observe the collision detection mechanism
Document the jam signal transmission and exponential backoff algorithm visualization
Measure and record the collision window (slot time) relative to propagation delay
Throughput Analysis
Calculating theoretical maximum throughput for different Ethernet standards
Open the Throughput Calculator
Select 10BASE-T standard with minimum frame size (64 bytes)
Record the efficiency and maximum throughput values
Repeat for maximum frame size (1518 bytes) and compare efficiency
Change to Gigabit Ethernet (1000BASE-T) and observe how efficiency changes with frame size
Plot a graph of efficiency vs. frame size for different Ethernet standards
Safety & Best Practices
- • Always verify MAC address formats (6 hexadecimal octets separated by colons)
- • Remember that minimum frame size (64 bytes) ensures proper collision detection
- • Understand that modern switched Ethernet uses full-duplex, eliminating collisions
- • Note the difference between half-duplex (CSMA/CD) and full-duplex operation modes
Laboratory Report Guidelines
Structure
Follow the standardized format for technical reports
Data Analysis
Include graphs, calculations, and error analysis
Conclusions
Critical thinking and real-world applications
Required Report Sections
1. Title Page
- • Experiment title: "Ethernet Technology and Protocol Analysis"
- • Student name, ID, and group number
- • Date of experiment and submission
- • Instructor name
2. Abstract / Objectives
- • Brief summary of experiments (100-150 words)
- • State 3-4 specific learning objectives
- • Mention key findings
3. Theory
- • IEEE 802.3 standard overview
- • Ethernet frame format with diagrams
- • CSMA/CD protocol explanation
- • Frame size constraints and their significance
4. Equipment and Tools
- • Virtual Laboratory Software (HTML5-based)
- • Frame Builder Simulator
- • CSMA/CD Visualization Tool
- • Throughput Calculator
5. Procedure
- • Step-by-step description of each experiment
- • Parameter settings used
- • Screenshots of key observations (if applicable)
6. Results and Data
- • Experiment 1: Hex dump of constructed frame, field identification table
- • Experiment 2: CSMA/CD timeline diagram, collision detection measurements
- • Experiment 3: Throughput calculation table for different standards
- • Include all raw data in tabular form
7. Analysis and Discussion
- • Explain why minimum frame size is 64 bytes
- • Analyze efficiency vs. frame size relationship
- • Compare half-duplex vs. full-duplex performance
- • Discuss practical implications of your findings
- • Identify sources of error or limitations
8. Conclusion
- • Summarize key findings (3-4 bullet points)
- • State whether objectives were achieved
- • Suggest improvements or further investigations
9. References
- • IEEE 802.3 standard documentation
- • Textbook references (Tanenbaum, Stallings, etc.)
- • Online resources (RFCs, technical papers)
- • Use IEEE citation format
Grading Rubric
| Criteria | Points | Requirements |
|---|---|---|
| Format & Organization | 10 | Proper structure, page numbering, headings |
| Theoretical Background | 15 | Complete and accurate theory section |
| Experimental Data | 25 | Complete data, proper tables, screenshots |
| Analysis & Calculations | 25 | Correct calculations, graphs, interpretation |
| Conclusions | 15 | Insightful, supported by data |
| References & Presentation | 10 | Proper citations, grammar, clarity |
| Total | 100 |
Submission Requirements
- Submit as PDF file only
- Due date: One week after lab session
- Individual reports (no group submissions)
- Use Times New Roman or Arial, 12pt, 1.5 line spacing
- Maximum length: 15 pages excluding appendices